BIM works flows of using Autodesk products, such as Infraworks, Civil 3d, Map 3d, Recap Pro and Navisworks that makes my life easier.

Tuesday, January 26, 2016

GIS into Revit using Dynamo

Revit does not have a import function for a GIS ESRI Shapefile. There are multiple work follows of using MAP 3d or Civil 3d and then importing a .dwg into Revit. Dynamo and the package of GIS  now allows the import function of points, curves and Polygons. The current Package on Dynamo only imports the geometry with in the Shape file and not attributed information, this is currently not available with in the GIS package.


The image of the Dynamo script below uses GIS package in Dynamo to read the shape file and insert point families into Revit. As noted before only the point and curve geometry is import into Revit, no attributed data. The Points are matrix transposes the point to suit the Revit base point to insert point base family in the correct location.


The above appears to be complex set of node but real are just a simple connection of node that performs a simple task; 

1. Read the ESRI Shapefile
2. Process the ESRI Shapefile into list
3. Get the Project Base Point and rotation
4. Matrix transform the point form the Project base point
5. Insert Point family from the transformed base points


The above image is a group of nodes to read the ESRI Shapefile

The process in the above image includes to read the entries of the points with in the Shape file. The result of the list on points is need to be inserted into the Code block to list


Group of nodes to get the project base Point.


The next node group is thanks to Wikipedia! If you can under stand Revit shared coordinates well try think of it backwards!!!

Revit's project base point is the mathematical set out point of the graphical data base. The project base point removes large numbers from the data base and makes the math simple. I actually don't know how to write it in words but to put it simple if you had the option of x =235982030, y=230923092, Z=14000 vs  x=1, y =1, z = 1 for every point as a reference point which one would you chose?  Well Revit makes it simple by using 1,1,1 and tell base point is the large number which is multiplied by linear algebra.  To get the reverse into Revit from Dynamo you need to take the points that you have and Matrix transform them from the Project base point and rotation to true north. Year 12 linear algebra, comes to mind.

Refer to the Wikipedia for Matrix transform https://en.wikipedia.org/wiki/Transformation_matrix

Rotation[edit]

For rotation by an angle θ clockwise about the origin the functional form is x' = x \cos \theta + y \sin \theta and y' =  -x \sin \theta + y \cos \theta. Written in matrix form, this becomes:[4]

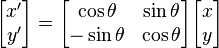
\begin{bmatrix} x' \\ y' \end{bmatrix} = \begin{bmatrix} \cos \theta &  \sin\theta \\ -\sin \theta & \cos \theta \end{bmatrix} \begin{bmatrix} x \\ y \end{bmatrix}

Simple math but complex to get at the start. 

Once the Points have been reversed transform then can been used as points with in Revit


Download the updated dynamo script Link
Download the shape file Example Link


Wednesday, January 06, 2016

Excel to Revit using Dyanamo

I've now been using Revit for 10 years and only in the last month through the use of Dynamo have I been able to use a command line like AutoCAD (on Steroids) . Revit does not have a input command line where you can specific coordinate but dynamo gives you the availability to do just that.


The image of the Dynamo script below uses excel as the input for coordinates and then the matrix transposes the point to suit the Revit base point to insert the point base family.
The above appears to be a complex set of node but real is just a simple connection of node that performs a simple task; 

1. Read the Excel Spread Sheet
2. Process the Excel sheet into a list
3. Get the Project Base Point and rotation
4. Matrix transform the point from the Project base point
5. Insert Point family from the transformed base points


The above image is a group of nodes to read the excel file.

The first Row within Excel has a heading (fields) that needs to be removed from the list to allow the clean list. 

Excel has a series of cells in which each data entry occurs. To make the data usable within Dynamo the data is required to be processed. The first set is to transpose the list in excel and then from there each column is broken into an individual lists. 


The individual list than can be used to transform the points as well as other functions within Dynamo. Using a simple Python script to split each column into individual lists.


Group of nodes to get the project base Point.


The next node group is thanks to Wikipedia! If you can understand Revit shared coordinates well try to think of it backwards!!!

Revit's project base point is the mathematical set out point of the graphical data base. The project base point removes large numbers from the data base and makes the math simple. I actually don't know how to write it in words but to put it simple if you had the option of x =235982030, y=230923092, Z=14000 vs  x=1, y =1, z = 1 for every point as a reference point which one would you chose?  Well, Revit makes it simple by using 1,1,1 and tell base point is the large number which is multiplied by linear algebra.  To get the reverse into Revit from Dynamo you need to take the points that you have and Matrix transform them from the Project base point and rotation to true north. Year 12 linear algebra, comes to mind.

Refer to the Wikipedia for Matrix transform https://en.wikipedia.org/wiki/Transformation_matrix

Rotation[edit]

For rotation by an angle θ clockwise about the origin the functional form is x' = x \cos \theta + y \sin \theta and y' =  -x \sin \theta + y \cos \theta. Written in matrix form, this becomes:[4]
\begin{bmatrix} x' \\ y' \end{bmatrix} = \begin{bmatrix} \cos \theta &  \sin\theta \\ -\sin \theta & \cos \theta \end{bmatrix} \begin{bmatrix} x \\ y \end{bmatrix}

Simple math but complex to get at the start. 


Once the Points have been reversed transform then can be used as points within Revit


Download the Example Dynamo Script Link

Download the Example excel Spreadsheet link


Monday, August 17, 2015

Stadium Station

Its been a long time since I've posted any thing new on my blog. I've been locked away working on a great project, which I would like to share with you.


This Video is just a small clip of the over view of the Project. 


Wednesday, June 10, 2015

Copying Coordinates System

A couple of years ago I wrote about how to create a local grid system for Perth coast Grid PCG94. You can copy the user definition of grid system from PC to PC using the following workflow, which Civil 3d, Map 3d and Infraworks access to the copied grid system.
The PC that does not have the defined Local grid system will need to configure Civil 3d or Map 3d to allows a definition of the grid system to be copied from PC to PC. The copied coordinates system will now be available in Infraworks. 
  • Set your workspace to Planning and Analysis
  • On the Map Setup Tab - Coordinate System click on the options (Small little arrow in bottom right-hand corner)
Coordanites System

The AutoCAD Map 3d option dialogue box and find the Coordinates system tab.

Automatically Add Defination to Dicatonies

Coordinate System Definitions Stored in Drawings select Prompt User or Automatically add.

Now open a .dwg that contains the user-defined coordinate system from the other PC that has the defined coordinate system. The defined coordinate system will now be available on the PC that previously missing the user-defined coordinate system including
Infraworks.
pcg94 define
You can download a sample .dwg that contains Perth Costal grid here PCG94

Thursday, July 10, 2014

Infrastructure BIM model

I've finished up working at DoT and haven't really had time to blog / document about the work flows from the project. The project was a business case for a tack slab through the heart of a CDB. My involvement was looking at the cost impact of existing services and infrastructure. This was done by traditional feature survey and laser scanning of the 22km (500gb of point cloud data) alignment to create a BIM model of existing services, using AS5488 (SUE) classification of subsurface utility information as a base line. Majority of the existing in-ground services where modelled to class C with a couple of major services to class B. The model consisted not only of the existing infrastructure but the proposed light rail infrastructure which was created with multiple software's. 

The simple definition of the BIM process to create the model would be similar to a carpenters set of tools, with each piece of software having its own key use. Similar to how a carpenter uses specific tools to construct a house. 

The exchange process between different platforms was done via landxml. 
A simple list of the software's used and their function. 
  • Bentley Rail used for the rail design
  • 12d used for the road design
  • Civil 3d for the existing surface and existing utilities 
The large data set of the point cloud was processed using Recap which reduced the file size of the point cloud data from about 500gb down to 150gb. Which had the point cloud data set usable on a 22km alignment. 

All of the above was placed into navisworks to run multiple rules to determine the impact of the light rail on the existing infrastructure with the results exported to excel to be processed and costed. 

This Video below and what has been described above is only a snippet of what was done. On the bottom of the screen each service is colour coded.


Some of workflows I've blogged about already and have many more work flows to come.


Wednesday, March 19, 2014

Navisworks - Negate Layers

Navisworks has the function to create search set to query your graphical data bases. I've been using Navisworks to perform clashes detection of services vs. a proposed light rail track slab.  The pipe layers have be predefined with the pipe orientation to the track slab . Therefore there would be 3 predefined possibility of  crossing the track slab, parallel to the track slab with in a predefined criteria offset and the third that it falls outside of Crossing or Parallel. Example of such a search would be to find all drainage pipes that are Crossing the track slab.
The search would look like the image below, for drainage find all pipethat are crossing the track slab.
Another search would be a pipe parallel to the track slab with in a predefined criteria offset.  The first two search are simple query because your able to search for  a key  string(Crossing or Parallel)  in the search set.  The third query would be search for every thing that is not Crossing and Parallel. Well this is where there is not a predefined condition of "does not contains"  Crossing and Parallel.
To create a does not contain query you first have to find the elements that you want to filter  out.
Find Item Layer Contains "Crossing"
Find Item Layer Contains "Parallel"
The above to lines need to be Negate Conditions.
Next you still need Navisworks to search for the remaining  items.
  • Find Item  Layer defined
The end result is you now have a does not query.


Thursday, March 13, 2014

Western Australia Data request for Infraworks

Creating an Infraworks model in Western Australia, data can be obtain from Landgate.

Example of such data available are:


  • Cultural features - buildings, general facility (eg library), industrial (eg pipeline), mine, place (eg town), tower (eg communications tower)
  • Ground surface data – elevation (eg contours, spot heights), fuzzy land (eg gully, dune), morphology (eg embankment, crater)
  • Hydrography - coastal flat, framework (eg coastline, marine construction), fuzzy water (eg swamp, lagoon), inland flat, inland water
  • Transport – bridge, tunnel, general transport (eg cycleway, wharf), rail segment, road, transport facility (eg airport, bus stop)
Below is an Example request form for obtaining data from landgate. Form can be found here 


Below is an example of data received from landgate after a request. There is plenty of data available to create a Infraworks model.


Below is an example of data from landgate in Infraworks

Monday, January 20, 2014

Creating DWF from Infraworks

Infraworks does not have a simple export to DWF. I came across this workflow because at the last minute some needed a model in a file format that was small and simple to use. A presentation with a 3d model  of the proposed building works vs 50 slides, I know which one I rather see. 

The short video below is a work flow that I've used to export Infraworks to DWF, with the help of 3ds MAX.

Key workflow points
  • Exporting is done by sending the model to 3ds MAX by the send to 3ds function. (3ds need to be installed on the PC for the function to be available)
  • 3ds MAX now has the selected region of the model and exporting dwf is as simple as export to dwf. 

Monday, January 13, 2014

Exporting Infraworks to Navisworks

Navisworks has never had a simple work flow of adding surface imagery without the use of 3ds Max. Infraworks add a easy. 

The short video below is a work flow that I've used to export Infraworks (before R4, in R4 the DDS texture mapping has been resolved) to Navisworks, with the help of a image convert like xnconvert

Key workflow points
  • Exporting is done by FBX as there is no direct export from Infraworks to Navisworks.
  • The FBX file when appended to Navisworks create a folder with all the associated images
  • The associated images need to be converted from .DDS to .JPEG and remapped when appending the .nwc.


Navisworks need to have the follwing setting set for the images to be processed.
  • Ensure that the Convert Textures is checked.
  
Another setting is to have the on which general Navisworks will prompt you to turn on. Is Presenter (OpenGL).


Tuesday, November 26, 2013

Coverage Area - Transparency

 Infraworks Coverage areas are great for defining work area / easement but some time you would like the area to be transparent. This is possible in Infraworks by changing the Alpha channel of the colour that defines your coverage area.

 The pink coverage area defines the area of work.

The colour setting of the Coverage area is set with an Alpha channel of 250, by changing the alpha channel the transparency of the coverage area changes.
 
 The Alpha channel is set to 100 in the image above to give a result in the image below of a transparent appearing coverage area.


Tuesday, November 12, 2013

Magic of PI and rotation of City furniture


Infraworks can take a 2d block in CAD software and create a 3d model with the easy of converting the block into to a GIS data set. 
The workflow for Infraworks City Furniture that is from a SDF with a value the represents it orientation in space. Mapexported angle are convert from Degrees to radian during the export process.  Infraworks does not have the following expression Functions:
  • PI (3.141592653589793)
or
  • RAD2DEG
Therefore to convert radian to degree is a bit of rough approach.

PI as a fraction is 245850922/78256779= 3.141592653589793
Radians to Degrees is "Segment Orientation" x (180 / PI)

A survey file with multiple blocks that represent each feature on a site. I want those site features in my Infraworks model. You can do a simple mapexport from Civil 3d or Map 3d and create a SDF file with each block classified by either layer name or block name. This simple process is great for feature elements that don't had a rotation. If survey file has not got the rotation that represents its true orientation a manual process will need to be done in Civil 3d or Map 3d. Below is a survey block of a traffic light with a rotation that represents it orientation.


Mapexport with the rotation of the block exported. The exported values for rotation end up in radians.


 Example of the traffic lights imported into Infraworks as City furniture with the Z rotation not yet assigned. Notice the traffic lights not oriented correctly.

PI or RAD2DEG are not recognised as expression values therefore to convert radian to degree is a bit of rough approach.

PI as a fraction is 245850922/78256779= 3.141592653589793
Radians to Degrees is "Segment Orientation" x (180 / PI)

In in the expression editor this would looks like

 ROTATION  *  (180 / (245850922/78256779))


Example of the traffic lights imported into Infraworks as City furniture with the Z rotation assigned. the traffic lights are now orientated correctly  


Monday, November 11, 2013

Navisworks - Exporting Clash Test

Navisworks Manage has a tool called Clash Detective. You can import and export your saved clash test to share between projects.. I discovered today that you can only export clash test that are set up using sets. Both selection A and selection B need to be Sets for you to export you clashes tests. I found that if you don't set your tests up this way you'll get a back xml with out the clash tests.

  • Below is an example of the test with selection A and Selection B as  Sets.

Wednesday, September 18, 2013

Creating Project Grid PCG94 - Perth Coast Grid

The Work flow for Creating a Project Grid system in Civil 3d 2014 that can then be used across other 2014 Autodesk platforms, example Autodesk Map 3d, Autodesk Recap Pro and Autodesk Infraworks.

To create a Project grid you need to obtain the parameter that define that grid system. The example below is base on Perth Coast grid 94. Landgate and MRWA have the parameters to define local gird for area through out WA. Landgate have the details here for PCG94.


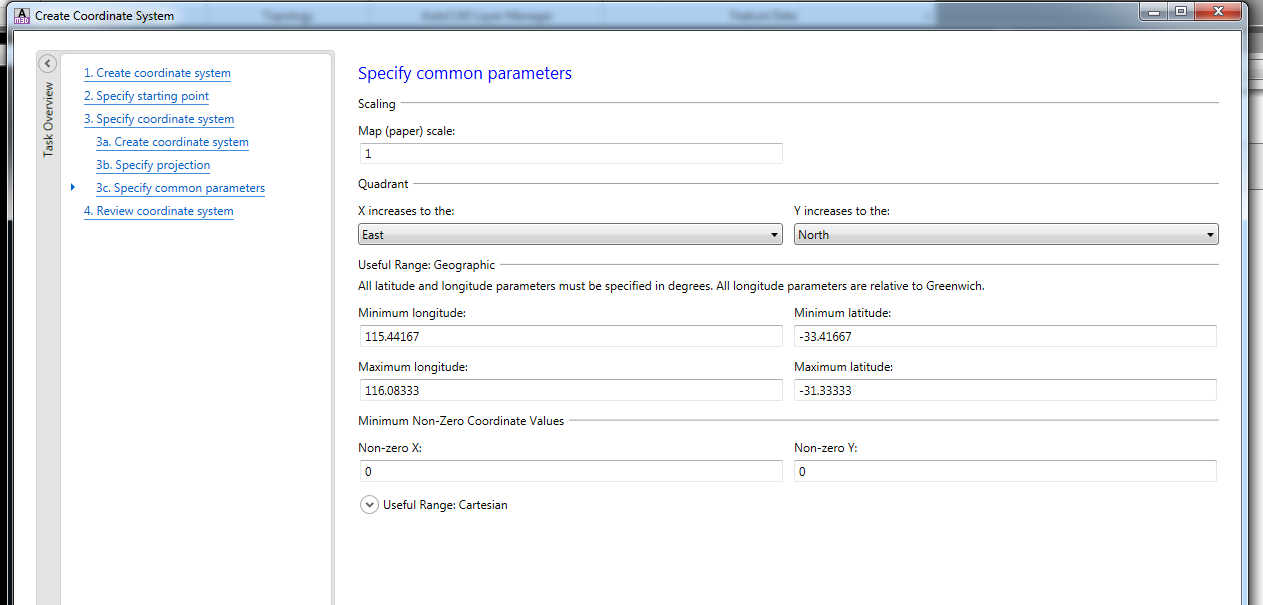
First to Create a Project grid in C3D use the _MAPCSCREATE. Follow the prompts. 

Start with a coordinate system.

The System is to be a Projected system.


Name the Project Grid System.

Base the System off GDA94.


Enter the Parameter that are found on Landgate website.


Review the Parameters and Click save.

Key Points
  • Use the exact numbers for the Parameter data. Do not round the data.